Improving the ROI of EHRs Through Analytics

Improving the ROI of EHRs Through Analytics

Improving the ROI of EHRs Through Analytics

Authored by Ayesha Rajan, Research Analyst at Altheia Predictive Health

Introduction 

As with any business feature, business owners and analysts must consider whether or not the cost associated with a feature is worth the return on investment. Electronic Health Records, though an integral part of the healthcare system, are a good example of a staple that does not often justify its cost. EHRs, of course, are extremely beneficial within healthcare, however, their high implementation and maintenance costs (think billions of dollars) means that they are not necessarily worth the investment unless steps are taken to optimize their use. Due to the fact that EHRs are ingrained into our healthcare system, the question isn’t whether or not they are worth the investment but how we can make them worth the investment? 

Discussion 

The first and most documented issues with EHRs is their accessibility and readability which limits their usability as well. Additionally, “EHR reports tend to run on a predetermined schedule, limiting how the data within the EHR can be used to evaluate key performance indicators, populations studies, or long-term trends” which further limits their ability to be improved upon. Many investors and market researchers say that the next step in EHR improvement is to invest heavily in programs and softwares that are able to translate the data from EHRs to other softwares so that it can be used across different contexts. This development will allow the power of analytics to significantly improve the return on investment for EHRs by providing insight and direction in terms of  bed management, case management, ED, workforce management, scheduling, and OR management systems [such that] staff can see the upstream and downstream effects of a single operational decision.” This is important because the time it takes to “translate” EHR data means that time has passed since data was collected and, in healthcare, real-time insights and decisions can be critical. Once the issue with readability and context application is solved, EHRs can be used to support predictive analytics endeavors by providing on-demand trend analysis and suggested steps to be verified by physicians. Such insight can cut costs for hospitals by tracking patient flow, for providers by creating demographic reports and for patients by reducing the number of tests needed for diagnosis. 

Conclusion 

The newest development in this space is a Google study’s use of deidentified EHRs to make patient health predictions. Though this project is still in the proof of concept phase, their prediction models have outperformed standard hospital models in every test thus far. This is a promising development in the optimization of EHR use that could encourage further research from smaller companies and at the university level, as well as inspire further investments towards the effort of getting the most out of Electronic Health Records. 


Prescriptive Analytics

Prescriptive Analytics

Prescriptive Analytics


Authored by Ayesha Rajan, Research Analyst at Altheia Predictive Health


Introduction

Here at Altheia Predictive Health, we are constantly improving techniques for disease prediction and diagnosis to improve the lives of people around the world. Where we leave off, companies like IBM pick up and begin applying analytics to the next step in the disease management process which is a treatment plan. Prescriptive analytics in healthcare can refer to several different things but in this article, we will look at prescriptive analytics as it related to the study of prescribed steps for those with chronic conditions to better understand how to manage disease conditions at various stages of a given condition. This can be an extremely useful tool for doctors who are looking at a borderline case and deciding whether or not to begin medication treatments by giving them the ability to see compiled and analyzed data for similar cases.

Discussion

After being diagnosed with a disease, the next question patients and providers have is what steps can be taken to prevent progression of the disease and manage the negative effects of a disease; for some people this is achieved through diet and exercise, for others it may be a prescribed medication and it is highly dependent on several patient factors. Prescriptive analytics is rooted in how to best solve a problem – if the problem is diabetes, a prescriptive model would look at variables in a patient’s file to determine if the problem can be mitigated through diet and exercise. If not, the model would then provide a game plan for how to begin prescribing medicines in the most effective way for any given patient. In diabetes patients, insulin therapy is a common form of treatment where adjustments to a specific individual can be tricky but prescriptive analytics can use the data of similar patients to provide a tried and true treatment plan.  Prescriptive analytics can also be used in radiation therapy by weighing various favors, such as treatment location and surrounding organs, to provide a highly targeted treatment plan that treats an area with a calibrated dosage while leaving the rest of the body as unharmed as possible. This is something that we as humans can make educated guesses on but the use of prescriptive analytics is likely much more accurate which means better care for patients. 

This field of study also has an incredibly relevant application amidst the Covid-19 Pandemic. Throughout the pandemic data has been collected on patients such as their age, BMI, gender, ethnicity, presence of chronic conditions and more. All of this information combined with their response to treatment plans provides a unique opportunity to apply analytics – by looking at these sets of data together, we can use artificial intelligence to understand which patients respond better to certain treatment plans. This provides a great opportunity to improve Covid-19 survival rates and lower the number of patients suffering from long-term complications as a result of Covid-19. 

Conclusion

Prescriptive analytics in healthcare is essentially a way for analytics to troubleshoot disease conditions by providing a data-based treatment plan. By providing physicians with analytical tools, such as prescriptive analytics, we can significantly improve their success rate in treatment plans and as a result improve the quality of life for hundreds of thousands of people.


Florida Covid-19 Predictions

Florida Covid-19 Predictions

Revisiting Our Covid-19 Predictions in Florida: What We Got Right, What We

Missed and What’s Next

Authored by Ayesha Rajan, Research Analyst at Altheia Predictive Health

Introduction

In our last article we reflected on our predictions regarding the spread of Covid-19. We made observations and predictions in March using linear regression and found that our data had an error rate of less than 10% when looking at the American population as a whole. However, many states had different rules and regulations for social distancing, mask wearing and other precautions, so we also made predictions based on different levels of regulations to predict the impact Covid-19 on hospitals and ICU beds. In this article, we will explore the accuracy of those predictions for the state of Florida and tools that can help us going forward as many states begin to see their number of Covid-19 cases spiking again. 


Analysis and Interpretation 

In our analysis we made the following predictions for the state of Florida based on different levels of precautions taken:

Predicted Hospitalizations with All Precautions Taken

April

May

June

Mid-June

July

August

2,208

2,028

18, 251 

19, 264

10, 139

2,208


Predicted Hospitalizations with Some Precautions Taken 

April

May

June

July

August

2,208

10,139

35,487

10,139

2,028


Predicted Hospitalizations with No Precautions Taken

April

May

Mid-May

June

Mid-June

July

August

2,208

20, 278

55, 766

40, 557

10, 139

3,042

2,028


While looking at this data, keep in mind that the number of hospital beds available in the state of Florida is 55,727. Looking back on our data, it’s clear that our model was very conservative. On one hand, we did accurately predict peaks and the fact that Florida would be overwhelmed with Covid-19 cases, however, we predicted that even with no precautions we would begin to see this come to an end in August. As we come to mid-July, Florida is the latest state to break American records with 15,000 new Covid-19 cases in one day which indicates that the end of the battle against Covid-19 in Florida is nowhere near over (Linton). In fact, as of July 7th, 2020, “at least 56 intensive care units in Florida hospitals reached capacity” with another 35 showing less than 10% availability (Chavez). 


The natural question to ask when making models such as these is how to improve them. In some ways, our model was conservative – in a no precautions setting, it was almost impossible that Florida could be in back in the same place it was in April. However, some error can be attributed to the lack of knowledge regarding the spread of coronavirus in March. We created these predictions based on Imperial College London’s pandemic model, however, the pandemic model could not account for the various changes, such as when and how certain things would reopen and was also based on the fact that we had a predicted end date. It was also limited in the fact that it was an agent-based model and not a stochastic model, which accounts for randomness such as the random meeting of two people and the impact they would have on their community if they were infected with Covid-19. The most accurate prediction models take in a lot more information about a more concentrated population. For example, it would not try to make every studied population follow the same multipliers because it would consider much more specified information about that population such as the occupations of a population, their ages and activities, their political engagement and beliefs, their methods of transportation, their attendance of religious functions and even more. 


Conclusion

What we can take away from this interpretation of data is that there is not a one size fits all model for pandemic predictions. Different counties, cities, states and countries all follow different schedules and habits and while most hospitals in Florida are overwhelmed, there are also likely some that barely see any or limited Covid-19 related issues. For this reason, it is extremely important to consider a lot more information about a more specified population than to use broad, blanketing equations; especially when the data is used for resource allocation. As we continue to battle Covid-19, it is important to take precautions such as wearing a mask in public places, practicing social distancing and maintaining good hygiene. 


Prevention

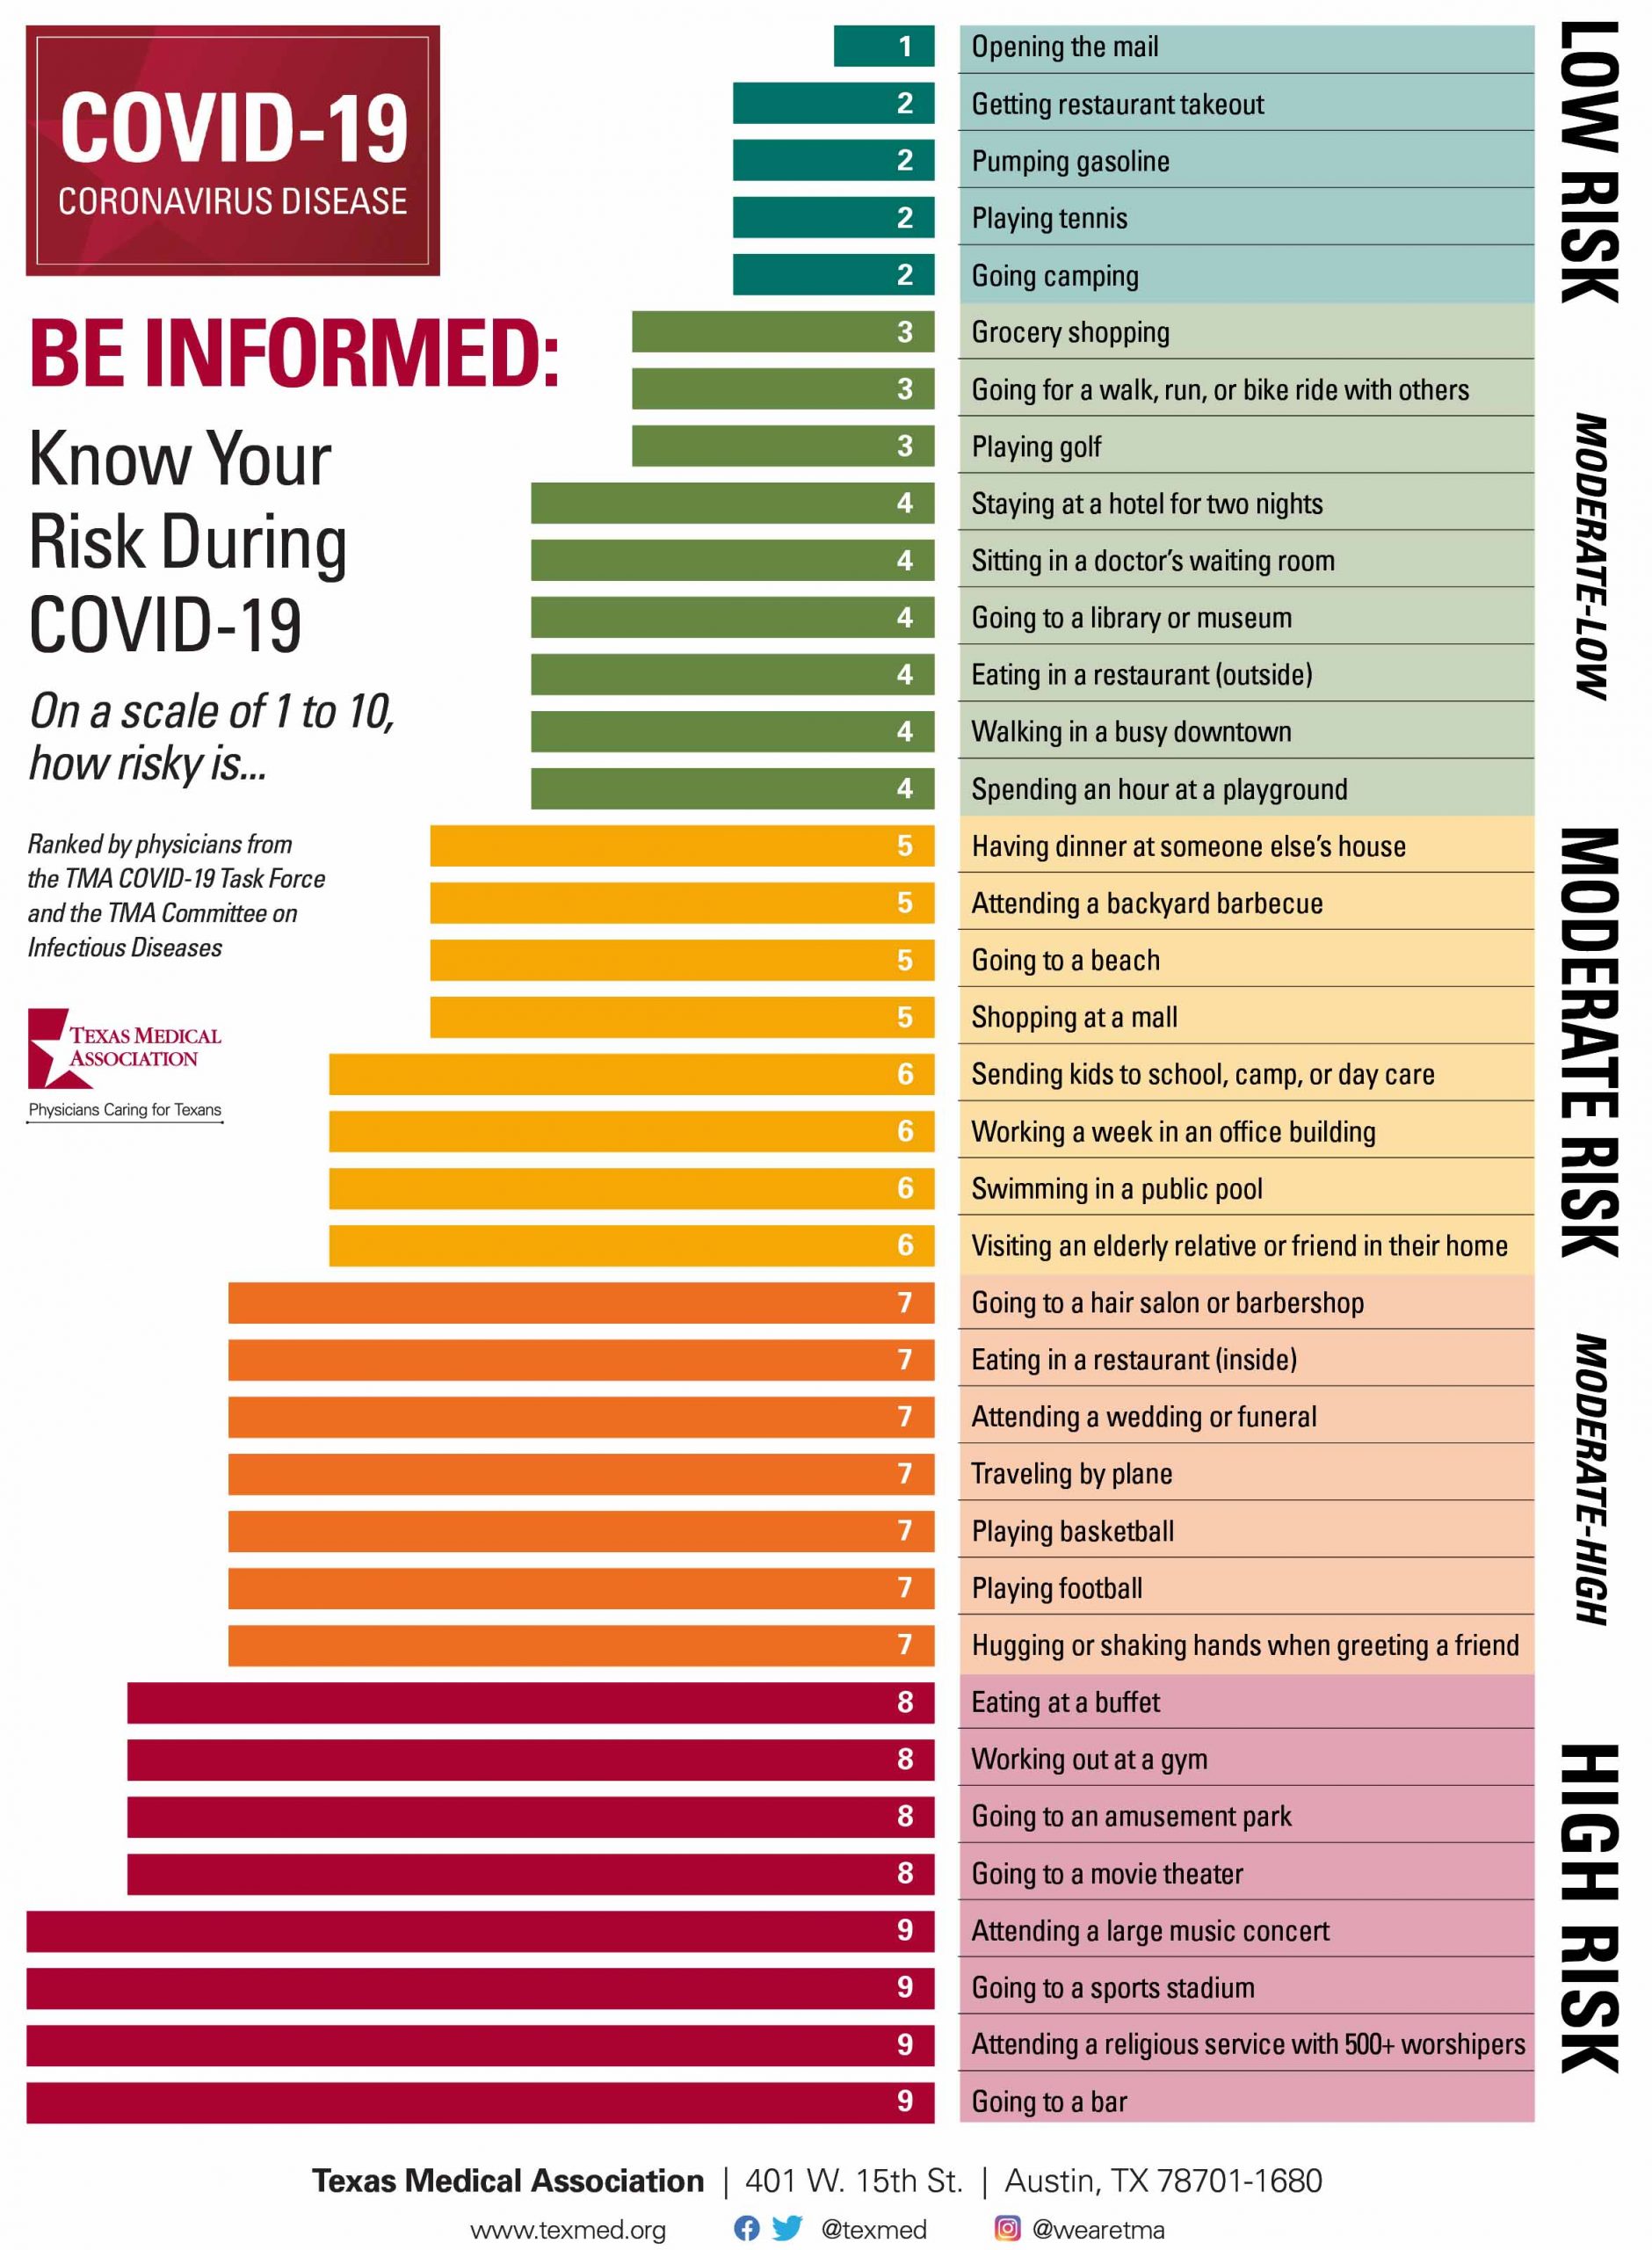
Take a look at the image below to see low to high-risk situations and understand how you can limit your exposure to Covid-19.


Florida Covid-19 Predictions

Reflecting on Our Covid-19 Predictions and How Analytics Can Continue to Help

Reflecting on Our Covid-19 Predictions and How Analytics Can Continue to Help

Authored by Ayesha Rajan, Research Analyst at Altheia Predictive Health

Introduction

As we climbed towards Covid-19 peaks across the country in March and April, we at Altheia Predictive Health looked at linear and exponential regression models of predicted case counts. We also used that data to make predictions regarding where hospitals would be overwhelmed. In recent weeks many states are seeing those peaks come back, so it seemed like the right time to look back at and reflect on our past Covid-19 predictions and look at how analytics can help us prepare for the second wave that many states are seeing come their way.

Discussion

When writing our first articles about Covid-19 we made two types of predictions for the U.S.– one used exponential regression and the other used linear regression.  As we noted in our previous articles, the curve had begun to flatten by the time we made our exponential regression observations so here we will focus on linear regression. For linear regression of total cases in the United States, our prediction table, as well as the actual case numbers and percent error are as follows:

Date

Predicted Value

Actual Value

Percent Error

April 10th, 2020

469,140

512,010

8.37%

April 11th, 2020

495,604

542,498

8.64%

April 12th, 2020

522,068

570,358

8.46%

April 13th, 2020

548,532

597,452

8.18%

April 14th, 2020

574,996

624,893

7.98%

April 15th, 2020

601,460

655,569

8.25%

April 16th, 2020 

627,923

685,712

8.42%


Though it is dependent on the scenario, a percent error of less than 10% is generally accepted as a fair prediction which bodes well, not only for validation of our predictions, but also for validation of linear regression as a tool to use in the planning, analysis and allocation of hospital resources. 

New Technology

Big data has been used at nearly every step in the battle of Covid-19. The first step is, of course, prevention. The most important part in prevention is to practice social distancing and other preventative measures and to maintain good hygiene and health. However, in terms of analytics, community tracking of Covid-19 cases can use contact networks to help mitigate risk in some ways. Think of someone who tested positive for Covid-19 as a member of a social network, such as Facebook. If you are friends with that person, you are in their network and your friends, even if they are not directly “friends” with the original positive case, are at risk because of their connection to you. Disease tracking works in a similar way by creating a network of everyone who came in contact with a positive case patient and who came in contact with those people, and so on.  

The next step is diagnosis and condition management and to help this effort, John McDevitt and his team at New York University have used artificial intelligence and big data to predict which Covid-19 patients are likely to experience severe cases. They did so by identifying biomarkers in blood tests of patients who died and patients who survived their battle with Covid-19. The research team found that there was a difference in the levels of C-reactive proteins, myoglobin, procalcitonin and cardiac troponin I. The patients who died of Covid-19 had elevated levels of these measurements; the researchers factored this into their risk equations (Kent). 

The next step in the battle against Covid-19 is the creation of a vaccine. While this is still very much “in the works,” scientists at 15 universities, including Johns Hopkins University, University of Wisconsin, University of Alabama, Pennsylvania State University and others, have partnered to share data samples of electronic health records to aid in the creation of a vaccine. The motivation behind this collaboration is to gather as much data about Covid-19 patients as possible in order to quickly identify patient responses to antiviral and anti-inflammatory treatments (Shephard).


Conclusion

As many states are hit with a second wave of Covid-19 cases, it is reassuring to know that analytics can be an extremely helpful tool in every stage of the disease. Analytics can identify at-risk groups that may need to take extra precautions in protecting themselves due either to exposure or preexisting conditions. Analytics tools are also useful at the care management stage where doctors can identify patients who need ventilators more than others if, as demonstrated during Italy’s first wave, there comes a time when decisions need to be made about where resources should be focused. Finally, these predictive tools will be helpful in the creation of a vaccine, especially when collaboration across research institutions is encouraged and beneficial. Ultimately, the existence and widespread use of analytics in disease prevention and management is an encouraging fact as it greatly accelerates our ability as a society to bounce back from the struggles caused by Covid-19.


Prevention

Take a look at the image below to see low to high-risk situations and understand how you can limit your exposure to Covid-19.


Works Cited

Kent, Jessica. “How Artificial Intelligence, Big Data Can Determine COVID-19 Severity.” HealthITAnalytics, 15 June 2020, healthitanalytics.com/news/how-artificial-intelligence-big-data-can-determine-covid-19-severity.

Shephard, Bob. “Enlisting Big Data to Accelerate the COVID-19 Fight – News.” UAB News, 2020, www.uab.edu/news/research/item/11371-enlisting-big-data-to-accelerate-the-covid-19-fight.

Quantifying Chronic Obstructive Pulmonary Disease

Quantifying Chronic Obstructive Pulmonary Disease

Quantifying Chronic Obstructive Pulmonary Disease

Authored by Ayesha Rajan, Research Analyst at Altheia Predictive Health

Introduction

Chronic Obstructive Pulmonary Disease, or COPD, is a chronic disease characterized by the inflammation of the lungs. This inflammation causes air to be obstructed from the lungs and can result in difficulty breathing, coughs, mucus and wheezing (Mayo Clinic). It affects at least 16 million Americans and 250 million people globally – it is a leading cause of death nationally and globally (Healthline). There are three main causes of COPD – the primary cause is exposure to tobacco smoke, the secondary is exposure to air pollution or fumes and the tertiary cause is due to asthma. Most COPD cases are the result of the first two causes and, as a result, are somewhat preventable; however, there is more to the story. COPD can also be the result of genetics and is correlated with the presence of other diseases which the field of analytics can help take into account in trying to predict COPD risk. As analytics continues to impact nearly every aspect of our lives, it is hopeful that it can also be a tool to help those suffering from Chronic Obstructive Pulmonary Disease.

Key Data Points

The main pieces of data needed to evaluate risk of COPD are lung function tests, the results of a chest x-ray, arterial blood gas analysis, sputum (mucus) test and the results of an Alpha-1-antitrypsin blood test. The Alpha-1-antitrypsin test is a genetic test that tells a patient whether or not they are deficient in the protein that protects the lungs from irritants; those who are deficient are likely develop COPD at a young age. This piece of information can be key to prevention because once COPD is present, it is irreversible (Healthline). Additionally, because COPD can cause hypertension, heart disease, diabetes and other health problems, it can be useful to look at the general metabolic panel.


New Technology and Relevant Studies

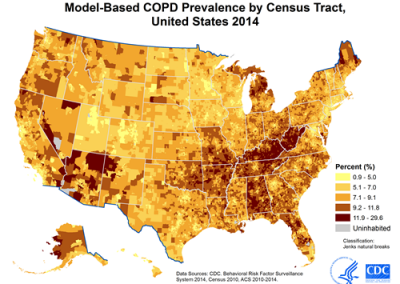
Another way to look at COPD from a data standpoint is through geocoding which looks at health conditions as the result of a surrounding environment. Geocoding is not a new form of data visualization but can be immensely helpful. For example, take a look at the image below:

This image shows us where prevalence of COPD is highest. Researchers can use this information to find commonalities between these cities to identify causes of COPD that may have been overlooked or not even considered. For example, one study found that in their studied population, lower winter ambient temperatures could be associated with increased COPD hospital admissions (Serra-Picamal). This is not surprising, because asthma symptoms worsen with colder air so one could expect to see similar statistics for COPD, however, it is not an assumption one can make without data-based proof. Of course, this is just one study, but it goes to show that data can pick up trends that we as humans cannott validate without proof.

Aside from diagnosis and progression predictions, analytics can also be used to improve care for COPD patients. At Intermountain Healthcare, a scoring system called Laboratory-based Intermountain Validated Exacerbation (LIVE) predicts mortality, morbidity and hospitalization rates for patients with COPD. The score is calculated by using hemoglobin, albumin, creatinine, chloride and potassium values to determine which patients are at risk of progression or death and to identify which patients need to move onto advanced care. In the first test of the LIVE scoring system, researchers found that it was able to successfully identify which patients were low or high risk at time of hospital admission and could produce a score that matched to the appropriate plan of care (Kent).


Prevention 

The best thing someone can do to prevent COPD is to stop smoking or stop exposure to secondhand smoke and air pollution. Following that, the best way to prevent COPD is to live a healthy lifestyle by maintaining good hygiene, keeping up to date with flu and pneumonia vaccines, eating a healthy diet and staying active.


Conclusion

Chronic Obstructive Pulmonary Disease is a disease that is highly preventable by maintaining a healthy lifestyle, however, there are factors that make certain groups more at risk than others. By combining the power of data with medicine, we can continue to compile a list of those factors to help those who are at risk prevent the disease before they have it. Analytics can also help in disease and care monitoring to improve hospital care for patients. As this field continues to develop, we can hope to see lower rates of incidence of COPD in the future and continually improving care for those who do have it.


Works Cited

“CDC – Data and Statistics – Chronic Obstructive Pulmonary Disease (COPD).” Centers for Disease Control and Prevention, Centers for Disease Control and Prevention, 5 June 2018, www.cdc.gov/copd/data.html.

“COPD.” Mayo Clinic, Mayo Foundation for Medical Education and Research, 15 Apr. 2020, www.mayoclinic.org/diseases-conditions/copd/symptoms-causes/syc-20353679.

Kent, Jessica. “Predictive Analytics, Risk Scores Improve Care for COPD Patients.” HealthITAnalytics, 9 Aug. 2019, healthitanalytics.com/news/predictive-analytics-risk-scores-improve-care-for-copd-patients.

Roland, James. “COPD Diagnosis: Spirometry, X-Ray, and 6 More Tests for COPD.” Healthline, Healthline Media, 17 Nov. 2018, www.healthline.com/health/copd/tests-diagnosis#takeaway.

Serra-Picamal, Xavier, et al. “Hospitalizations Due to Exacerbations of COPD: A Big Data Perspective.” Respiratory Medicine, W.B. Saunders, 16 Jan. 2018, www.sciencedirect.com/science/article/abs/pii/S095461111830009X.

Thomas, Jen. “COPD: Facts, Statistics, and You.” Healthline, Healthline Media, 14 May 2019, www.healthline.com/health/copd/facts-statistics-infographic#8.

Analytics use of ethnicity

Analytics use of ethnicity

Improving Predictive Healthcare Models by Filtering for Racial Differences in Data

Authored by Ayesha Rajan, Research Analyst at Altheia Predictive Health

Introduction

Risk calculators are at the forefront of analytics in healthcare – using ranges to understand who might be at risk of contracting a disease and when they might contract it, is a powerful tool but it doesn’t stop there. Analytics can also help us to better understand disease progression and manage symptoms, however, these tools often underserve racial and ethnic minorities because of the lack of inclusion of race-adjusted ranges in the metabolic and blood panels. To better serve the general population, racial differences in health data must be taken into consideration and used where applicable to make analytics a beneficial tool to all. In recent years, several studies have explored this topic and we will take a look at some of them in this article.

Current Problem

The biggest challenge in this research space is collecting data – for example, the link between breast cancer and race in women proves that at least some disparities in cancer diagnoses boil down to racial differences. One of the contributing factors to this disparity is many randomized clinical trials become stalled due to lack of enrollment (Zewde)[1].

Consequently, data segmented by racial differences can be difficult to obtain. The next biggest challenge is identifying when race is the impactful variable. Many people of the same race and ethnicity often share similar cultural practices so relationship, lifestyle, location, and other variables can influence the interaction of panel data and race. One-way that the National Center for Biotechnology

Information (NCBI) suggests tackling this is by administering more comprehensive questionnaires so that such parameters can be factored out to identify the root cause of a disparity.

Emerging Technology and Studies

This field of research is central to our mission at Altheia Predictive Health. Our proprietary predictive health models take race into account when creating risk ranges to ensure that each individual receives information that is personalized to their background. We can see in much of our research that risk ranges vary among race and ethnic groups with many minorities being classified at a higher risk than Caucasian Americans even with the same variable being measured. By including race as a parameter in predictive algorithms, we can train machines to better interpret and apply the most accurate data possible and, as a result, increase the accuracy of these algorithms.

There is more to this area of research; outside of diagnosing and managing diseases, analytics also identifies racial disparities in care management programs. In a study at Portland State University, researchers observed patients in a hospital emergency room and studied the way nurses and physicians interacted with people of varying races and ethnicities. Researchers found that “Black patients were 32 percent less likely to receive pain medication than white patients, while Hispanic patients were 21 percent less likely to receive pain medication than their white counterparts. Asian patients were 24 percent less likely to receive pain medication than white individuals. This was despite the fact that black and Hispanic patients reported higher average pain scores than white patients.” [2]

Conclusion

Ultimately, analytics applications are a tool and just a piece of the puzzle; there is still an element of human touch that will always be necessary to bring together the entire picture. Without taking race and ethnicity into account, analytics applications lack accuracy and context that human interpretation can add to predictive analytics models so that they can better serve a much wider community. As this field continues to develop, the biggest struggle for researchers will continue to be lack of enrollment in studies. However, by expanding the questions asked and information documented on Electronic Health Record for those who do participate in studies, we can make great strides in determining when race and ethnicity are strongly correlated to disease contraction and progression. 

Works Cited

[1] Zewde, Makda. “Tracking Health Disparities with Big Data.” NPHR Blog, 20 Oct. 2017,  nphr.wordpress.com/2017/10/19/tracking-health-disparities-with-big-data/#prettyPhoto.

[2] Kent, Jessica. “EHR Data Reveals Racial Disparities in Emergency Pain Treatment.” HealthITAnalytics, 20 Dec. 2019, healthitanalytics.com/news/ehr-data-reveals-racial-disparities-in-emergency-pain-treatment.