Reflecting on Our Covid-19 Predictions and How Analytics Can Continue to Help
Authored by Ayesha Rajan, Research Analyst at Altheia Predictive Health
Introduction
As we climbed towards Covid-19 peaks across the country in March and April, we at Altheia Predictive Health looked at linear and exponential regression models of predicted case counts. We also used that data to make predictions regarding where hospitals would be overwhelmed. In recent weeks many states are seeing those peaks come back, so it seemed like the right time to look back at and reflect on our past Covid-19 predictions and look at how analytics can help us prepare for the second wave that many states are seeing come their way.
Discussion
When writing our first articles about Covid-19 we made two types of predictions for the U.S.– one used exponential regression and the other used linear regression. As we noted in our previous articles, the curve had begun to flatten by the time we made our exponential regression observations so here we will focus on linear regression. For linear regression of total cases in the United States, our prediction table, as well as the actual case numbers and percent error are as follows:
|
Date |
Predicted Value |
Actual Value |
Percent Error |
|
April 10th, 2020 |
469,140 |
512,010 |
8.37% |
|
April 11th, 2020 |
495,604 |
542,498 |
8.64% |
|
April 12th, 2020 |
522,068 |
570,358 |
8.46% |
|
April 13th, 2020 |
548,532 |
597,452 |
8.18% |
|
April 14th, 2020 |
574,996 |
624,893 |
7.98% |
|
April 15th, 2020 |
601,460 |
655,569 |
8.25% |
|
April 16th, 2020 |
627,923 |
685,712 |
8.42% |
Though it is dependent on the scenario, a percent error of less than 10% is generally accepted as a fair prediction which bodes well, not only for validation of our predictions, but also for validation of linear regression as a tool to use in the planning, analysis and allocation of hospital resources.
New Technology
Big data has been used at nearly every step in the battle of Covid-19. The first step is, of course, prevention. The most important part in prevention is to practice social distancing and other preventative measures and to maintain good hygiene and health. However, in terms of analytics, community tracking of Covid-19 cases can use contact networks to help mitigate risk in some ways. Think of someone who tested positive for Covid-19 as a member of a social network, such as Facebook. If you are friends with that person, you are in their network and your friends, even if they are not directly “friends” with the original positive case, are at risk because of their connection to you. Disease tracking works in a similar way by creating a network of everyone who came in contact with a positive case patient and who came in contact with those people, and so on.
The next step is diagnosis and condition management and to help this effort, John McDevitt and his team at New York University have used artificial intelligence and big data to predict which Covid-19 patients are likely to experience severe cases. They did so by identifying biomarkers in blood tests of patients who died and patients who survived their battle with Covid-19. The research team found that there was a difference in the levels of C-reactive proteins, myoglobin, procalcitonin and cardiac troponin I. The patients who died of Covid-19 had elevated levels of these measurements; the researchers factored this into their risk equations (Kent).
The next step in the battle against Covid-19 is the creation of a vaccine. While this is still very much “in the works,” scientists at 15 universities, including Johns Hopkins University, University of Wisconsin, University of Alabama, Pennsylvania State University and others, have partnered to share data samples of electronic health records to aid in the creation of a vaccine. The motivation behind this collaboration is to gather as much data about Covid-19 patients as possible in order to quickly identify patient responses to antiviral and anti-inflammatory treatments (Shephard).
Conclusion
As many states are hit with a second wave of Covid-19 cases, it is reassuring to know that analytics can be an extremely helpful tool in every stage of the disease. Analytics can identify at-risk groups that may need to take extra precautions in protecting themselves due either to exposure or preexisting conditions. Analytics tools are also useful at the care management stage where doctors can identify patients who need ventilators more than others if, as demonstrated during Italy’s first wave, there comes a time when decisions need to be made about where resources should be focused. Finally, these predictive tools will be helpful in the creation of a vaccine, especially when collaboration across research institutions is encouraged and beneficial. Ultimately, the existence and widespread use of analytics in disease prevention and management is an encouraging fact as it greatly accelerates our ability as a society to bounce back from the struggles caused by Covid-19.
Prevention
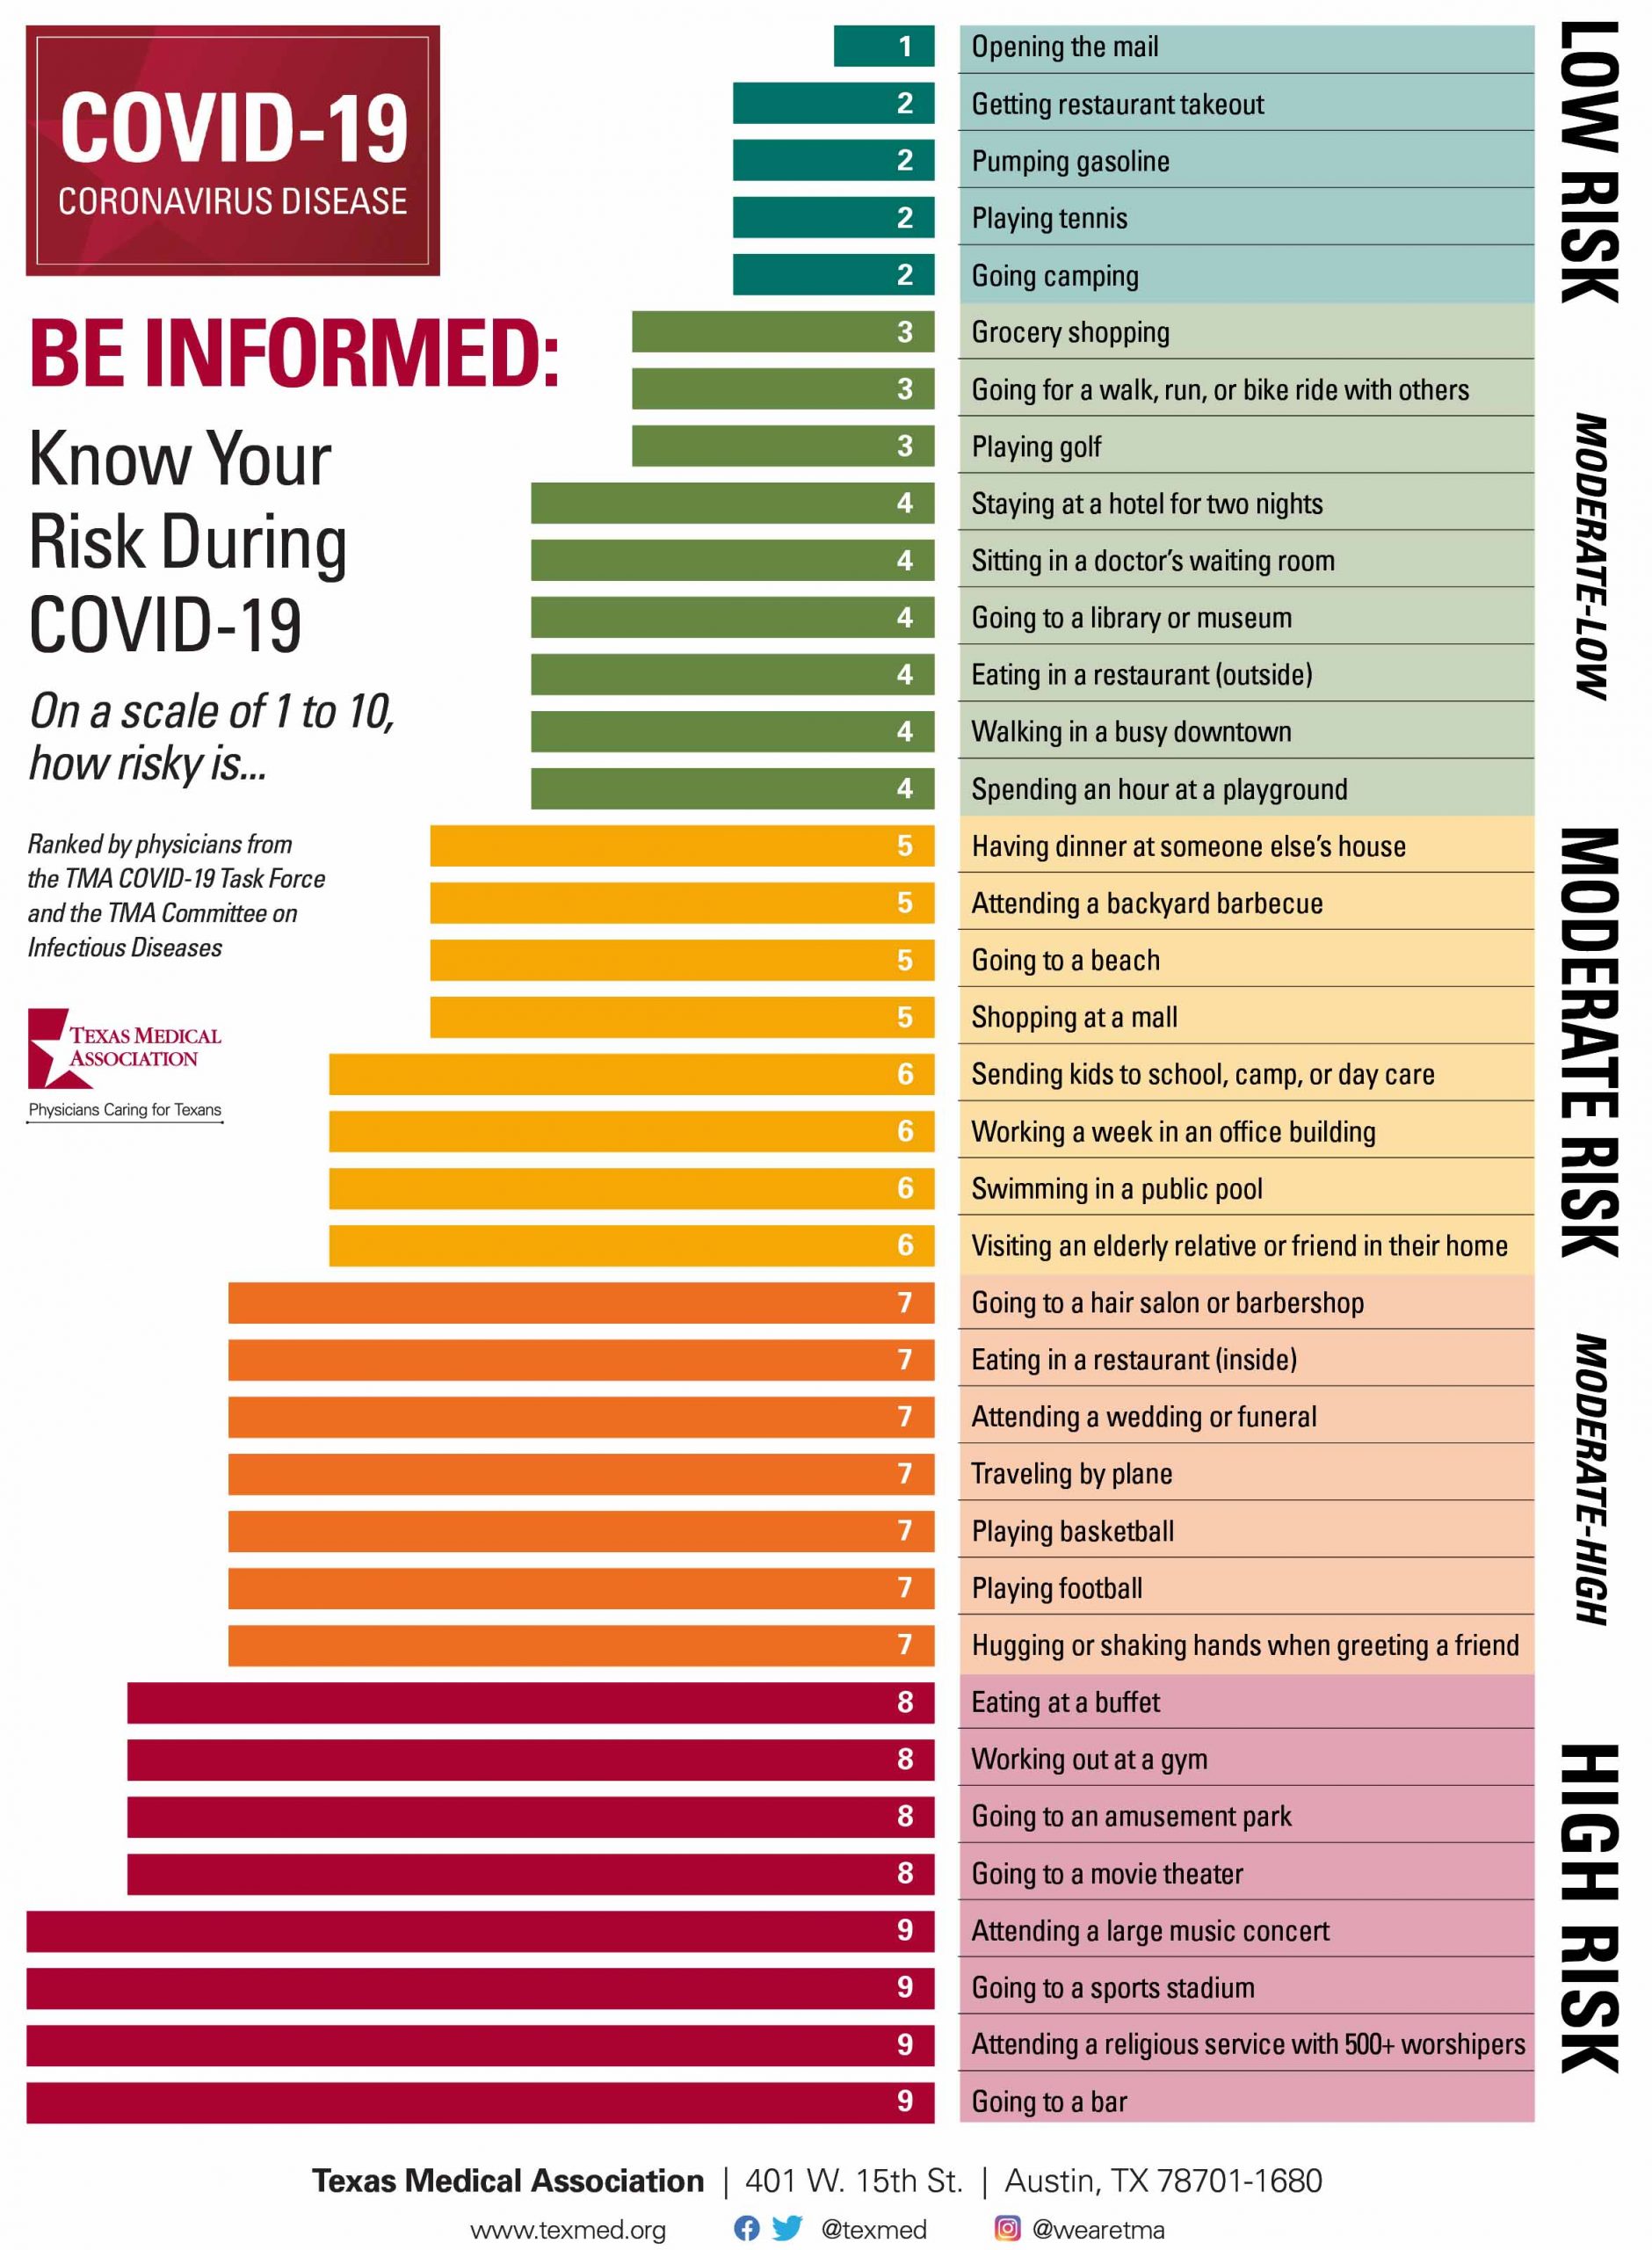
Take a look at the image below to see low to high-risk situations and understand how you can limit your exposure to Covid-19.

Works Cited
Kent, Jessica. “How Artificial Intelligence, Big Data Can Determine COVID-19 Severity.” HealthITAnalytics, 15 June 2020, healthitanalytics.com/news/how-artificial-intelligence-big-data-can-determine-covid-19-severity.
Shephard, Bob. “Enlisting Big Data to Accelerate the COVID-19 Fight – News.” UAB News, 2020, www.uab.edu/news/research/item/11371-enlisting-big-data-to-accelerate-the-covid-19-fight.
