
Quantifying Chronic Obstructive Pulmonary Disease
Authored by Ayesha Rajan, Research Analyst at Altheia Predictive Health
Introduction
Chronic Obstructive Pulmonary Disease, or COPD, is a chronic disease characterized by the inflammation of the lungs. This inflammation causes air to be obstructed from the lungs and can result in difficulty breathing, coughs, mucus and wheezing (Mayo Clinic). It affects at least 16 million Americans and 250 million people globally – it is a leading cause of death nationally and globally (Healthline). There are three main causes of COPD – the primary cause is exposure to tobacco smoke, the secondary is exposure to air pollution or fumes and the tertiary cause is due to asthma. Most COPD cases are the result of the first two causes and, as a result, are somewhat preventable; however, there is more to the story. COPD can also be the result of genetics and is correlated with the presence of other diseases which the field of analytics can help take into account in trying to predict COPD risk. As analytics continues to impact nearly every aspect of our lives, it is hopeful that it can also be a tool to help those suffering from Chronic Obstructive Pulmonary Disease.
Key Data Points
The main pieces of data needed to evaluate risk of COPD are lung function tests, the results of a chest x-ray, arterial blood gas analysis, sputum (mucus) test and the results of an Alpha-1-antitrypsin blood test. The Alpha-1-antitrypsin test is a genetic test that tells a patient whether or not they are deficient in the protein that protects the lungs from irritants; those who are deficient are likely develop COPD at a young age. This piece of information can be key to prevention because once COPD is present, it is irreversible (Healthline). Additionally, because COPD can cause hypertension, heart disease, diabetes and other health problems, it can be useful to look at the general metabolic panel.
New Technology and Relevant Studies
Another way to look at COPD from a data standpoint is through geocoding which looks at health conditions as the result of a surrounding environment. Geocoding is not a new form of data visualization but can be immensely helpful. For example, take a look at the image below:
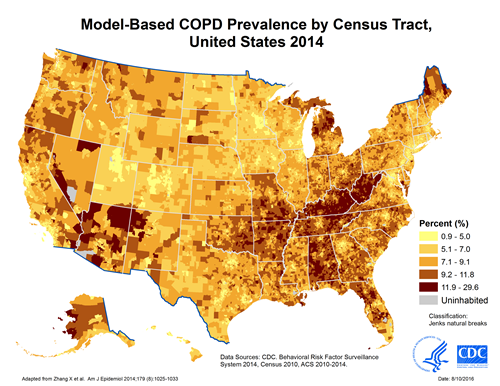
This image shows us where prevalence of COPD is highest. Researchers can use this information to find commonalities between these cities to identify causes of COPD that may have been overlooked or not even considered. For example, one study found that in their studied population, lower winter ambient temperatures could be associated with increased COPD hospital admissions (Serra-Picamal). This is not surprising, because asthma symptoms worsen with colder air so one could expect to see similar statistics for COPD, however, it is not an assumption one can make without data-based proof. Of course, this is just one study, but it goes to show that data can pick up trends that we as humans cannott validate without proof.
Aside from diagnosis and progression predictions, analytics can also be used to improve care for COPD patients. At Intermountain Healthcare, a scoring system called Laboratory-based Intermountain Validated Exacerbation (LIVE) predicts mortality, morbidity and hospitalization rates for patients with COPD. The score is calculated by using hemoglobin, albumin, creatinine, chloride and potassium values to determine which patients are at risk of progression or death and to identify which patients need to move onto advanced care. In the first test of the LIVE scoring system, researchers found that it was able to successfully identify which patients were low or high risk at time of hospital admission and could produce a score that matched to the appropriate plan of care (Kent).
Prevention
The best thing someone can do to prevent COPD is to stop smoking or stop exposure to secondhand smoke and air pollution. Following that, the best way to prevent COPD is to live a healthy lifestyle by maintaining good hygiene, keeping up to date with flu and pneumonia vaccines, eating a healthy diet and staying active.
Conclusion
Chronic Obstructive Pulmonary Disease is a disease that is highly preventable by maintaining a healthy lifestyle, however, there are factors that make certain groups more at risk than others. By combining the power of data with medicine, we can continue to compile a list of those factors to help those who are at risk prevent the disease before they have it. Analytics can also help in disease and care monitoring to improve hospital care for patients. As this field continues to develop, we can hope to see lower rates of incidence of COPD in the future and continually improving care for those who do have it.
Works Cited
“CDC – Data and Statistics – Chronic Obstructive Pulmonary Disease (COPD).” Centers for Disease Control and Prevention, Centers for Disease Control and Prevention, 5 June 2018, www.cdc.gov/copd/data.html.
“COPD.” Mayo Clinic, Mayo Foundation for Medical Education and Research, 15 Apr. 2020, www.mayoclinic.org/diseases-conditions/copd/symptoms-causes/syc-20353679.
Kent, Jessica. “Predictive Analytics, Risk Scores Improve Care for COPD Patients.” HealthITAnalytics, 9 Aug. 2019, healthitanalytics.com/news/predictive-analytics-risk-scores-improve-care-for-copd-patients.
Roland, James. “COPD Diagnosis: Spirometry, X-Ray, and 6 More Tests for COPD.” Healthline, Healthline Media, 17 Nov. 2018, www.healthline.com/health/copd/tests-diagnosis#takeaway.
Serra-Picamal, Xavier, et al. “Hospitalizations Due to Exacerbations of COPD: A Big Data Perspective.” Respiratory Medicine, W.B. Saunders, 16 Jan. 2018, www.sciencedirect.com/science/article/abs/pii/S095461111830009X.
Thomas, Jen. “COPD: Facts, Statistics, and You.” Healthline, Healthline Media, 14 May 2019, www.healthline.com/health/copd/facts-statistics-infographic#8.