Applying Data Science to Nutrition
Applying Data Science to Nutrition
Authored by Ayesha Rajan, Research Analyst at Altheia Predictive Health
Introduction
In all of our articles regarding the application of data science to various diseases, we always include tips for prevention. One tip we always include is to make smart decisions when it comes to nutrition and the foods you ingest. This means avoiding processed when possible and opting for choices that provide your body with necessary and beneficial nutrients. The benefits of a healthy diet are well documented and in this week’s article we will take a look at how data science can improve our understanding of our dietary choices, as well improve our health.
Discussion
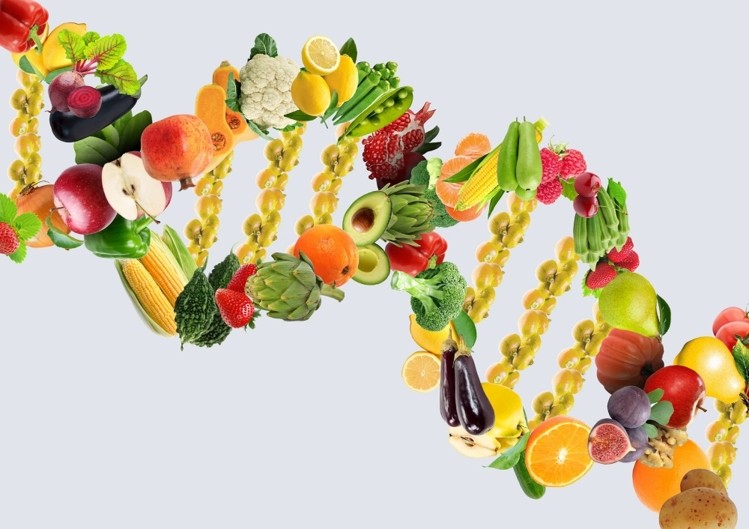
When it comes to looking at how nutrition affects our health, we are usually looking specifically at the field of nutrigenomics which is essentially the study of the biological processes that take place after the ingestion of a certain food or combination of foods. To conduct tests in this space, a researcher will usually take bodily measurements such as height, weight, health conditions, drug intake and dosage, blood pressure, glucose levels and more. Then, similar to how studies are performed for diabetes or hypertension studies, data sets collected are processed by a range of data science tools, such as “cluster detection, memory-based reasoning, genetic algorithms, link analysis, decision trees, and neural networks.”
One of the biggest struggles in regards to understanding the results of these studies is that no two bodies are exactly the same so there is a lot of variation when it comes to how certain foods affect our bodies. For this reason, large scale studies must be the norm in this field, especially when it comes to understanding how certain foods affect those with a specific condition.
One company leading the way in making nutrition a data science related field of study is Nutrino. Nutrino leverages AI and machine learning to understand how measurable nutrition decisions affect user inputs such as “allergies, physical activity, sleep, mood, glucose, and insulin level.” It also takes in user information in regards to preexisting conditions to analyze how dietary decisions affect those users more accurately, as well as to help them manage their chronic conditions.
Conclusion
The application of the information discovered through the application of data science to nutrition can be extremely impactful for those with chronic conditions by figuring out which foods can best support their health goals. However, this can also be very helpful to the general population and those without chronic conditions by simply helping us better understand how our nutrition decisions impact our lives and can help prevent diseases. As the health and functional foods industry continues to grow faster than ever before, there is certainly market demand for further research in this space.