by Jolly Nanda | Jul 2, 2020 | Analytics
Quantifying Chronic Obstructive Pulmonary Disease
Authored by Ayesha Rajan, Research Analyst at Altheia Predictive Health
Introduction
Chronic Obstructive Pulmonary Disease, or COPD, is a chronic disease characterized by the inflammation of the lungs. This inflammation causes air to be obstructed from the lungs and can result in difficulty breathing, coughs, mucus and wheezing (Mayo Clinic). It affects at least 16 million Americans and 250 million people globally – it is a leading cause of death nationally and globally (Healthline). There are three main causes of COPD – the primary cause is exposure to tobacco smoke, the secondary is exposure to air pollution or fumes and the tertiary cause is due to asthma. Most COPD cases are the result of the first two causes and, as a result, are somewhat preventable; however, there is more to the story. COPD can also be the result of genetics and is correlated with the presence of other diseases which the field of analytics can help take into account in trying to predict COPD risk. As analytics continues to impact nearly every aspect of our lives, it is hopeful that it can also be a tool to help those suffering from Chronic Obstructive Pulmonary Disease.
Key Data Points
The main pieces of data needed to evaluate risk of COPD are lung function tests, the results of a chest x-ray, arterial blood gas analysis, sputum (mucus) test and the results of an Alpha-1-antitrypsin blood test. The Alpha-1-antitrypsin test is a genetic test that tells a patient whether or not they are deficient in the protein that protects the lungs from irritants; those who are deficient are likely develop COPD at a young age. This piece of information can be key to prevention because once COPD is present, it is irreversible (Healthline). Additionally, because COPD can cause hypertension, heart disease, diabetes and other health problems, it can be useful to look at the general metabolic panel.
New Technology and Relevant Studies
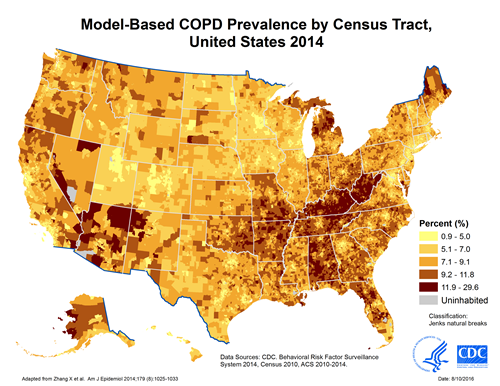
Another way to look at COPD from a data standpoint is through geocoding which looks at health conditions as the result of a surrounding environment. Geocoding is not a new form of data visualization but can be immensely helpful. For example, take a look at the image below:
This image shows us where prevalence of COPD is highest. Researchers can use this information to find commonalities between these cities to identify causes of COPD that may have been overlooked or not even considered. For example, one study found that in their studied population, lower winter ambient temperatures could be associated with increased COPD hospital admissions (Serra-Picamal). This is not surprising, because asthma symptoms worsen with colder air so one could expect to see similar statistics for COPD, however, it is not an assumption one can make without data-based proof. Of course, this is just one study, but it goes to show that data can pick up trends that we as humans cannott validate without proof.
Aside from diagnosis and progression predictions, analytics can also be used to improve care for COPD patients. At Intermountain Healthcare, a scoring system called Laboratory-based Intermountain Validated Exacerbation (LIVE) predicts mortality, morbidity and hospitalization rates for patients with COPD. The score is calculated by using hemoglobin, albumin, creatinine, chloride and potassium values to determine which patients are at risk of progression or death and to identify which patients need to move onto advanced care. In the first test of the LIVE scoring system, researchers found that it was able to successfully identify which patients were low or high risk at time of hospital admission and could produce a score that matched to the appropriate plan of care (Kent).
Prevention
The best thing someone can do to prevent COPD is to stop smoking or stop exposure to secondhand smoke and air pollution. Following that, the best way to prevent COPD is to live a healthy lifestyle by maintaining good hygiene, keeping up to date with flu and pneumonia vaccines, eating a healthy diet and staying active.
Conclusion
Chronic Obstructive Pulmonary Disease is a disease that is highly preventable by maintaining a healthy lifestyle, however, there are factors that make certain groups more at risk than others. By combining the power of data with medicine, we can continue to compile a list of those factors to help those who are at risk prevent the disease before they have it. Analytics can also help in disease and care monitoring to improve hospital care for patients. As this field continues to develop, we can hope to see lower rates of incidence of COPD in the future and continually improving care for those who do have it.
Works Cited
“CDC – Data and Statistics – Chronic Obstructive Pulmonary Disease (COPD).” Centers for Disease Control and Prevention, Centers for Disease Control and Prevention, 5 June 2018, www.cdc.gov/copd/data.html.
“COPD.” Mayo Clinic, Mayo Foundation for Medical Education and Research, 15 Apr. 2020, www.mayoclinic.org/diseases-conditions/copd/symptoms-causes/syc-20353679.
Kent, Jessica. “Predictive Analytics, Risk Scores Improve Care for COPD Patients.” HealthITAnalytics, 9 Aug. 2019, healthitanalytics.com/news/predictive-analytics-risk-scores-improve-care-for-copd-patients.
Roland, James. “COPD Diagnosis: Spirometry, X-Ray, and 6 More Tests for COPD.” Healthline, Healthline Media, 17 Nov. 2018, www.healthline.com/health/copd/tests-diagnosis#takeaway.
Serra-Picamal, Xavier, et al. “Hospitalizations Due to Exacerbations of COPD: A Big Data Perspective.” Respiratory Medicine, W.B. Saunders, 16 Jan. 2018, www.sciencedirect.com/science/article/abs/pii/S095461111830009X.
Thomas, Jen. “COPD: Facts, Statistics, and You.” Healthline, Healthline Media, 14 May 2019, www.healthline.com/health/copd/facts-statistics-infographic#8.
by Jolly Nanda | Jun 25, 2020 | Analytics
Improving Predictive Healthcare Models by Filtering for Racial Differences in Data
Authored by Ayesha Rajan, Research Analyst at Altheia Predictive Health
Introduction
Risk calculators are at the forefront of analytics in healthcare – using ranges to understand who might be at risk of contracting a disease and when they might contract it, is a powerful tool but it doesn’t stop there. Analytics can also help us to better understand disease progression and manage symptoms, however, these tools often underserve racial and ethnic minorities because of the lack of inclusion of race-adjusted ranges in the metabolic and blood panels. To better serve the general population, racial differences in health data must be taken into consideration and used where applicable to make analytics a beneficial tool to all. In recent years, several studies have explored this topic and we will take a look at some of them in this article.
Current Problem
The biggest challenge in this research space is collecting data – for example, the link between breast cancer and race in women proves that at least some disparities in cancer diagnoses boil down to racial differences. One of the contributing factors to this disparity is many randomized clinical trials become stalled due to lack of enrollment (Zewde)[1].
Consequently, data segmented by racial differences can be difficult to obtain. The next biggest challenge is identifying when race is the impactful variable. Many people of the same race and ethnicity often share similar cultural practices so relationship, lifestyle, location, and other variables can influence the interaction of panel data and race. One-way that the National Center for Biotechnology
Information (NCBI) suggests tackling this is by administering more comprehensive questionnaires so that such parameters can be factored out to identify the root cause of a disparity.
Emerging Technology and Studies
This field of research is central to our mission at Altheia Predictive Health. Our proprietary predictive health models take race into account when creating risk ranges to ensure that each individual receives information that is personalized to their background. We can see in much of our research that risk ranges vary among race and ethnic groups with many minorities being classified at a higher risk than Caucasian Americans even with the same variable being measured. By including race as a parameter in predictive algorithms, we can train machines to better interpret and apply the most accurate data possible and, as a result, increase the accuracy of these algorithms.
There is more to this area of research; outside of diagnosing and managing diseases, analytics also identifies racial disparities in care management programs. In a study at Portland State University, researchers observed patients in a hospital emergency room and studied the way nurses and physicians interacted with people of varying races and ethnicities. Researchers found that “Black patients were 32 percent less likely to receive pain medication than white patients, while Hispanic patients were 21 percent less likely to receive pain medication than their white counterparts. Asian patients were 24 percent less likely to receive pain medication than white individuals. This was despite the fact that black and Hispanic patients reported higher average pain scores than white patients.” [2]
Conclusion
Ultimately, analytics applications are a tool and just a piece of the puzzle; there is still an element of human touch that will always be necessary to bring together the entire picture. Without taking race and ethnicity into account, analytics applications lack accuracy and context that human interpretation can add to predictive analytics models so that they can better serve a much wider community. As this field continues to develop, the biggest struggle for researchers will continue to be lack of enrollment in studies. However, by expanding the questions asked and information documented on Electronic Health Record for those who do participate in studies, we can make great strides in determining when race and ethnicity are strongly correlated to disease contraction and progression.
by Jolly Nanda | Jun 20, 2020 | Analytics
Do Analytics Discriminate? Disparities in Algorithms Across Various Racial and Ethnic Groups
Authored by Ayesha Rajan, Research Analyst at Altheia Predictive Health
Introduction
Patients who come in with concerns about kidney function are always tested for their glomerular filtration rate(GFR). It is interesting to note, the GFR is factored into the Kidney Failure Risk Equation and other algorithms differently for African Americans but remains standard across all other ethnic and racial minority groups. However, across several other predictive health algorithms and risk calculators, racial differences in the metabolic panel are typically not considered. Given that different racial and ethnic groups have different predispositions to and progressions of diseases, this is an area that needs improvement. As the field of medicine moves towards analytics to predict patient risk, medication needs and other factors, it is important to consider the benefits of increased accuracy by taking race into consideration when creating algorithms, as well as the implications of biased algorithms.
Current Problem
In 2019, NBC reported on an algorithm written by Optum that was heavily biased. The algorithm was used to rank patients that would most benefit from a care program that aimed to manage responsible use of medication and to keep patients out of the hospital. In a group of 6,000 black patients and 44,000 white patients, only 17.5% of people recommended for the program were black despite the fact that the black patients had 26.3% more chronic conditions. Developers had to ask themselves why this was the case and found that their cost-based algorithm left behind black patients because of monetary biases – black patients spend $1,800 less per year than white patients with the same conditions. This means that black patients with the same or worse chronic conditions than white patients were left behind because of their inability to pay. Once Optum balanced that aspect of the algorithm, they saw the number of black patients recommended for the program jump from 17.5% to 46.5% (Gawronski). This example shows disparities in algorithms that we can not always anticipate but that still negatively affect certain racial groups.
Analytics As A Solution
In October of 2019, George Washington University received a grant to study these types of disparities. The four-year study is still in its earliest stages, but it will help researchers better identify the relationships between race and disease prediction. Yan Ma, who is the Vice Chair of the Department of Bioinformatics at George Washington University, says that one of the biggest and easiest steps that can be taken to improve this situation is for large databases to include a patient’s ethnic group and/or race in their information. In fact, it’s surprising that many data bases do not already have this data. If they did, it would make machine learning and artificial intelligence even more powerful tools than they are currently (Kent).
The Centers for Medicare & Medicaid Services echo the same sentiment in their studies of using racial data to improve healthcare treatment for all patients, citing lack of clear and reliable data as the biggest roadblock to their research and the area most in need of improvement. Currently, Medicare uses (and has been using for quite some time) a method called geocoding to target at risk communities. Geocoding makes predictions about a person’s health based on the characteristics of the areas in which they live. It works in the way that many would like algorithms to account for racial differences; it takes into consideration the population health and trends of a community to make more targeted predictions about a person’s health. This method is limited because it is not exact and is highly dependent on areas that self-segregate. It does however lay out the groundwork for how a study could separate certain groups to identify their specific risk factors and general health.
Conclusion
While data science tools such as machine learning and artificial intelligence have significantly advanced the field of medicine, there are many people that are left behind because of biased equations. In order to best serve all communities it is important that healthcare providers and companies that are creating predictive algorithms take differences in racial predispositions into account and adjust metabolic and blood panels in the same way to provide the best care to each unique patient.
Works Cited
Gawronski, Quinn. “Racial Bias Found in Widely Used Health Care Algorithm.” NBCNews.com, NBCUniversal News Group, 7 Nov. 2019, www.nbcnews.com/news/nbcblk/racial-bias-found-widely-used-health-care-algorithm-n1076436.
Kent, Jessica. “Machine Learning to Uncover Racial Disparities in Healthcare.” HealthITAnalytics, 31 Oct. 2019, healthitanalytics.com/news/machine-learning-to-uncover-racial-disparities-in-healthcare.
Llanos, Karen. “Using Data on Race and Ethnicity to Improve Health Care Quality for Medicaid Beneficiaries.” CHCS, 2006, www.chcs.org/media/Using_Date_to_Reduce_Health_Disparities.pdf.
by Jolly Nanda | Jun 10, 2020 | Analytics
Authored by Ayesha Rajan, Research Analyst at Altheia Predictive Health
Introduction
Chronic Kidney Disease is a condition involving the gradual loss of kidney function; your kidneys filter blood to remove waste and toxins which in turn helps control blood pressure and maintain red blood cell function and bone health so their ability to function properly is clearly very important. Chronic Kidney disease is caused by presence of diabetes, high blood pressure, obstruction of the urinary tract and range of other conditions including glomerulonephritis, interstitial nephritis, polycystic kidney disease, vesicoureteral and pyelonephritis (Mayo Clinic). Many patients do not realize they have Chronic Kidney Disease until it has progressed quite far in the 5 stages but when symptoms do show up, they include itching, muscle cramps, lack of appetite, nausea, unusual swelling, changes in frequency of urination and trouble breathing or sleeping. Once diagnosed, the disease is managed by slowing the progression of kidney damage to prevent end-stage kidney failure which necessitates dialysis or a kidney transplant. Currently, 15% of the American population (37 million people) has Chronic Kidney Disease but many of them do not know it – this is a frightening data point given that 340 people begin dialysis treatment every that and that kidney disease is the 9th leading cause of death in the United States (CDC). Additionally, UC San Francisco has calculated that CKD costs $79 billion dollars for Medicare patients and predicts that 16.7% of the population will contract CKD by 2030 which shows a clear need for further research in this area (Kent).
Key Data Points
Several factors increase a patients’ risk of chronic kidney disease including presence of diabetes or hypertension, heart disease, smoking activity, obesity, race (African Americans, Native Americans and Asian Americans are all higher risk race groups), family history and age (Mayo Clinic). These factors are often factored into predictive algorithms along with blood panels which hold key variables such as Albumin to Creatinine Ration (ACR), Serum Creatinine, Blood Urea Nitrogen (BUN) and Glomerular Filtration Rate (GFR). Urine tests can also measure relevant variables such as Urine Protein, Microalbuminuria and Creatine Clearance Rate. All of these variables measure kidney function and can predict the onset or stage of Chronic Kidney Disease.
Current Research
An important study out of Cairo University utilized multiple algorithms to study the importance of physical variables in class identification of CKD. The study used probabilistic neural networks, multilayer perceptron, support vector machine and radial basis function algorithms to identify which algorithm would most accurately identify a patients’ stage of CKD. The study found that the probabilistic neural network algorithm yielded the highest classification accuracy at 96.7% and used that information to add weight to each considered variable and improve the prediction performance of CKD stage diagnosis. This study showed that each variable was, indeed, not weighted equally. In fact, there was a significant difference between the 100% importance of serum creatinine and a 9.256% importance of hypertension in diagnosis. This is important in identifying at risk groups because, clearly, not everyone with hypertension will have CKD but those at high risk serum creatinine levels are very likely to need treatment (Rady). Research conducted in the United States around CKD draws from the following databases for information: The National Health and Nutrition Examination Survey; United States Renal Data System; Kaiser Permanente; and Veterans Affairs Healthcare System. These databases are essential to the use of artificial intelligence and machine learning techniques because they can provide ranges for many of the physical variables listed above. However, outside of physical variables, research has also been done on nonconventional risk factors of CKD. For example, several studies have evaluated air pollution using “of land-use regression and spatiotemporal models that utilized satellite remote-sensing aerosol optical depth data” to associate air pollution with incidence of CKD in a population. These studies have concluded that increased air pollution could be correlated with incidence of CKD and decrease of glomerular filtration rate. Another study using artificial intelligence used clinical notes to evaluate predictors of CKD and found high-dose ascorbic acid and fast food consumption to be novel predictors (NCBI). Artificial intelligence can actually do most of the heavy lifting in studies like these in which we can gain insight into the impact of factors that we may have never otherwise considered to be relevant in the study of Chronic Kidney Disease.
Conclusion
Chronic Kidney Disease affects (and will continue to affect) a significant number of the population and it is clear that more research needs to be done in this area. To make that possible, some things need to change. For example, accessibility to medical data needs to be made easier so that research can happen at various levels, i.e. medical, academic and corporate. This ensures that those who want to research these topics can do so without the time constraints of existing rules and regulations so that developments can be made mainstream to patients and providers in the timeliest matter. Additionally, federal funding could be redirected to research in this area to improve data processing techniques which are currently fragmented and hinder the success rate of the existing multidimensional algorithms.
Prevention
The necessary steps for preventing Chronic Kidney Disease are very much in line with leading a generally healthy life. Mayo Clinic recommends that one maintain a healthy weight through physical exercise and calorie reduction, not smoke and follow responsible usage guidelines for over-the-counter medications as abusing pain relievers can cause kidney damage. Furthermore, if you are at risk, it is important to check in with your physician frequently to track and manage symptoms of Chronic Kidney Disease (Mayo Clinic). If you are unsure about whether or not you might be at risk of contracting kidney disease, you may consider using the CDC’s Chronic Kidney Disease Risk Calculator at: https://nccd.cdc.gov/CKD/Calculators.aspx#tab-Bang.
Works Cited
“Chronic Kidney Disease Basics.” Centers for Disease Control and Prevention, Centers for Disease Control and Prevention, 7 Feb. 2020, www.cdc.gov/kidneydisease/basics.html.
“Chronic Kidney Disease.” Mayo Clinic, Mayo Foundation for Medical Education and Research, 15 Aug. 2019, www.mayoclinic.org/diseases-conditions/chronic-kidney-disease/symptoms-causes/syc-20354521.
Kent, Jessica. “Chronic Kidney Disease Patients Face Significant Care Disparities.” HealthITAnalytics, HealthITAnalytics, 17 July 2019, healthitanalytics.com/news/chronic-kidney-disease-patients-face-significant-care-disparities.
Rady, El-Houssainy A., and Ayman S. Anwar. “Prediction of Kidney Disease Stages Using Data Mining Algorithms.” Informatics in Medicine Unlocked, Elsevier, 7 Apr. 2019, www.sciencedirect.com/science/article/pii/S2352914818302387.
Zeng, Xiao-Xi, et al. “Big Data Research in Chronic Kidney Disease.” Chinese Medical Journal, Medknow Publications & Media Pvt Ltd, 20 Nov. 2018, www.ncbi.nlm.nih.gov/pmc/articles/PMC6247601/.