Tracking Covid-19 Resource Requirements Across the US Healthcare System
Ayesha Rajan, Research Analyst at Altheia Predictive Health
Background
In this article we are discussing findings and inferences from 1.3 million outpatient records provided by the Centers for Medicaid and Medicare Services (“CMS”). The data set includes the records of Medicare patients with a mix of chronic conditions seen for outpatient encounters in the past 3 years. We are applying our findings to identify the kinds of patients that are at a higher risk for contracting the Coronavirus disease 2019, also known as Covid-19. Given the fact that Italy has been hit especially hard by Covid-19 due to its vast elderly population, the analysis of our own elderly American population is important for both preparation and prevention.
Findings
Since all the patients in our sample are participants in Medicare, we know that the vast majority are already part of the at-risk group. The Centers for Disease Control (“CDC”) has also identified those who have Heart Disease and Diabetes to be at an increased risk of contracting Covid-19, as well as anyone with a serious underlying medical condition such as Chronic Obstructive Pulmonary Disease (“COPD”).
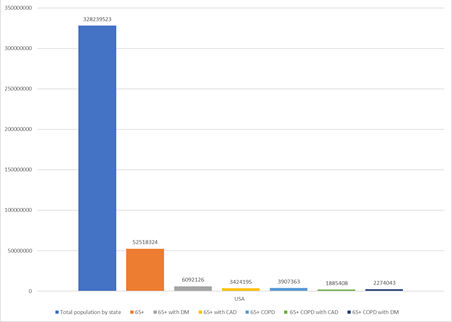
The CDC has already published that 8 out of 10 deaths reported in the U.S. have been in adults 65 years of age and older. Using the 2019 census data, which provides that the U.S. population is 328.23 million, we can infer that 16% of the total population of the U.S. or 52.5 million people are vulnerable. Co-morbidity of this population with COPD and Diabetes Mellitus (“DM”) or Coronary Artery Disease (“CAD”) elevates this risk.
We have been working with Medicare data for researching and refining algorithms to create better predictive models for chronic diseases. With the outbreak of Covid-19, we though it vital to share our findings of the co-morbid conditions and Covid-19 to create better preparedness.
What we were able to extract from our data set of 1,315,025 patient records is the percentages of people with overlapping preexisting conditions. Listed below are those that occur most frequently, translated from percentages to real numbers. Amongst an elderly US population, the groups of patients with DM with COPD and those with CAD with COPD are at the highest risk if exposed to Covid-19 (see Figure 2).
Figure 2

Hospitalization, ICU admissions and Deaths
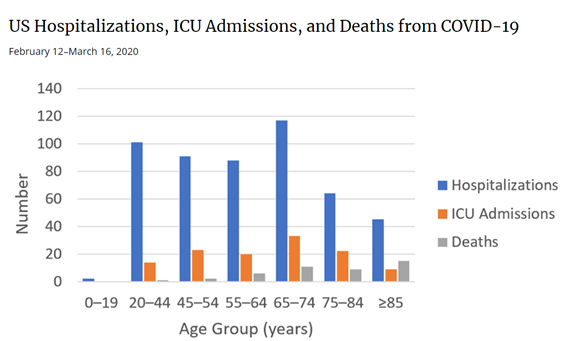
We then looked at the CDC chart below for Hospitalization, ICU admissions and Deaths, which support the identification of the elderly as being at a significantly high risk for mortality.
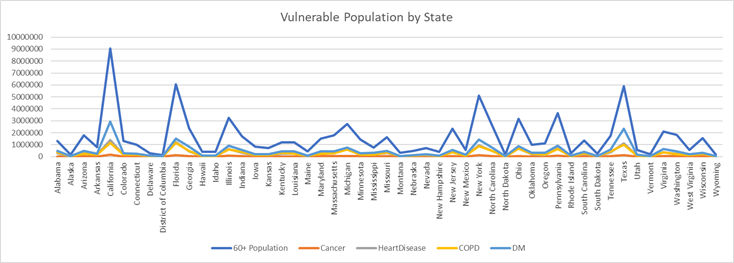
Vulnerable Population by State
We also analyzed publicly available data from the CDC and Census data by State to identify hot spots by total population over 60 years of age, and to identify COPD, DM, Heart Disease and Cancer. The chart below shows areas where we predict an overflow of healthcare needs.
Imperial College Model
The Imperial College Covid-19 Response Team published a model that shows that even with flattening the curve with voluntary quarantine, closure of schools, including colleges and universities, social distancing of entire populations, including and especially the elderly and vulnerable, we only succeed at lowering the curve. We are just at the onset of the upward curve. The “light blue” line shows that we will peak in critical care bed needs by mid-June 2020.

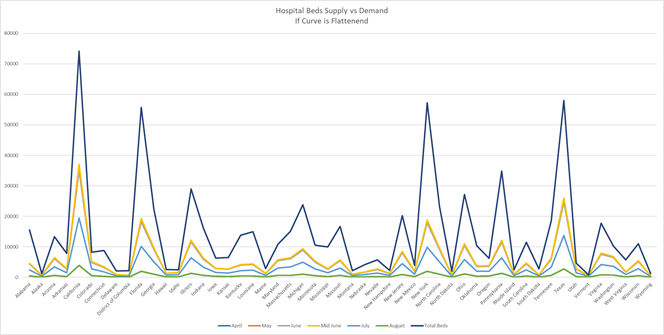
Hospital Beds – Supply vs. Demand
Looking at the data, as many healthcare professionals are predicting, hospitals will soon be overwhelmed by Covid-19 patients, many of whom will have one or more preexisting conditions.
Hospitals are already trying to increase their supplies of respiratory machines, but that alone will not help if an influx of patients that arrive in need of other treatment, including insulin, dialysis or attention to coronary issues. As hospitals prepare to increase the resources available to treat Covid-19 patients, they must also consider that many of these patients will need other types of medical treatment. This additional care will create expenses that insurance companies (including Medicare) will have to factor into its cost projections.
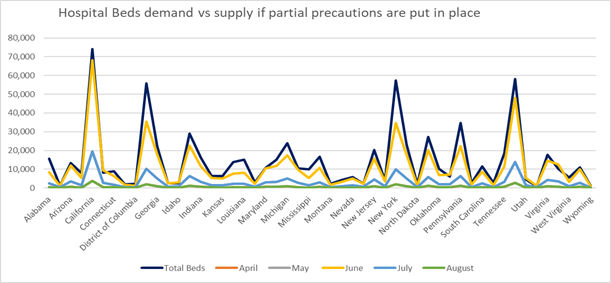
Hospital Beds – Supply vs. Demand with Precautions
If precautions are put in place to manage the spread of Covid-19, we will see that peak demand will occur in June, but that demand will be comfortably met by every state. However, if we do not take the necessary precautions of quarantine, social distancing and closing businesses with a broad brush, we can expect there to be peaks in demand for hospital beds that will not be met. Below we can see figures that represent the demand for hospital beds if some action is taken and if no action at all is taken. While the peaks are further apart if some action is taken, many states will still face overwhelming demand.
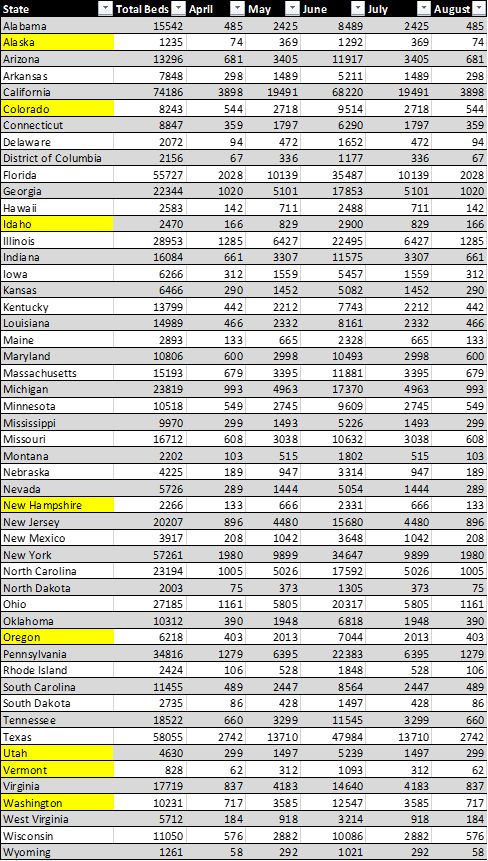
If some precautions are taken, we will see that peak demand will hit in June. At that time states like Colorado, Idaho, New Hampshire, Oregon, Utah, Vermont and Washington will no longer have enough beds to meet demand. States like Alaska, Hawaii, Maine, Montana, New Mexico, North Dakota, Rhode Island and Wyoming are at risk of finding themselves the same predicament.
Hospital Beds – Supply vs. Demand with No Precautions
If no precautions are taken, we will see peak demand in mid-May at which time the demand for hospital beds will be higher than the available number of beds in nearly every state.
Conclusion
In reviewing all published data, we strongly support the decisions to close schools, including colleges and universities, cancel all non-essential services and continue to practice social distancing across all ages. We can see that without these measures, hospitals in many states face high demand for beds with limited supply.
The CDC states that the high-risk group of Americans aged 65 years of age and older comprises 31% of Covid-19 cases. Therefore, as the number of these patients increase, it is key to factor in that many of these patients will need treatment for other medical issues, such as COPD, CAD or DM, in addition to their treatment for Covid-19.
Further analysis can be conducted at the county level across the U.S. to identify shortages of critical healthcare assets. This is essential to ensuring medical treatment, supplies and transportation and evacuation services are in place to meet projected demand.
We will continue to analyze the data and publish this county level data within a few days.
Citations
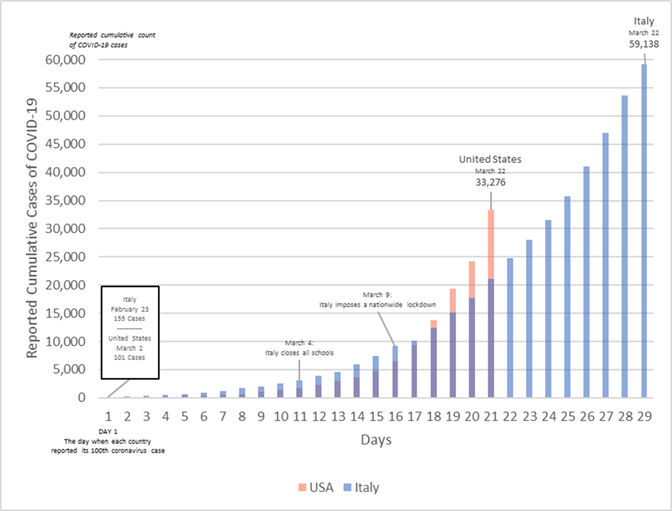
Figure 1: Johns Hopkins via Vox.com
Animashaun, Christina, and Kelsey Piper. “Why We’re Not Overreacting to the Coronavirus, in One Chart.” Vox, Vox, 20 Mar. 2020, www.vox.com/future-perfect/2020/3/20/21179040/coronavirus-us-italy-not-overreacting.
Figure 2: Created by author using Census Data by State
Figure 3: Total Population versus Vulnerable (Per CDC 65+ and then looking at 65+ with Diabetes, Coronary Artery Disease and COPD, Co-morbidity of COPD with DM and CAD from CDC Data
Figure 4: CDC via Fox News;
Hein, Alexandria. “8 In 10 Coronavirus-Related Deaths in US Involve Older Adults: CDC.” Fox News, FOX News Network, 19 Mar. 2020, www.foxnews.com/health/8-in-10-coronavirus-related-deaths-us-involve-older-adults-cdc.
Figure 5, 7, 8, 9: Created by author(s) using data from the CDC and census.gov
Figure 6: Imperial College London
Ferguson, Neil. “Impact of Non-Pharmaceutical Interventions (NPIs) to Reduce COVID- 19 Mortality and Healthcare Demand.” Https://Www.imperial.ac.uk, 2020, www.imperial.ac.uk/media/imperial-college/medicine/sph/ide/gida-fellowships/Imperial-College-COVID19-NPI-modelling-16-03-2020.pdf.
Additional Information
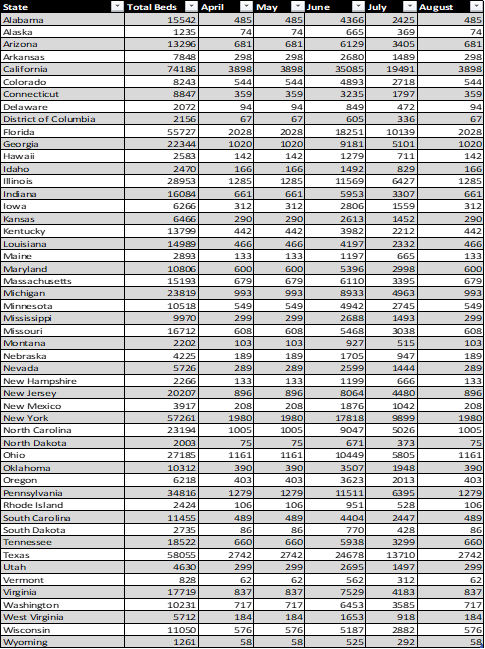
Figure 7 and 8 may appear to be missing data, however, the values were too small to be seen on the graph.
Below is the full table of data used.
For Figure 7 Table Below was used.
For Figure 8, the following table was used: